BPM-RO的操作压力比传统的反渗透膜低2至4倍,因此消耗的能量更少。

在低压下运行,加上独特的中空纤维膜结构,大大减少了膜表面的结垢和堵塞,从而促进水处理系统持续运行。

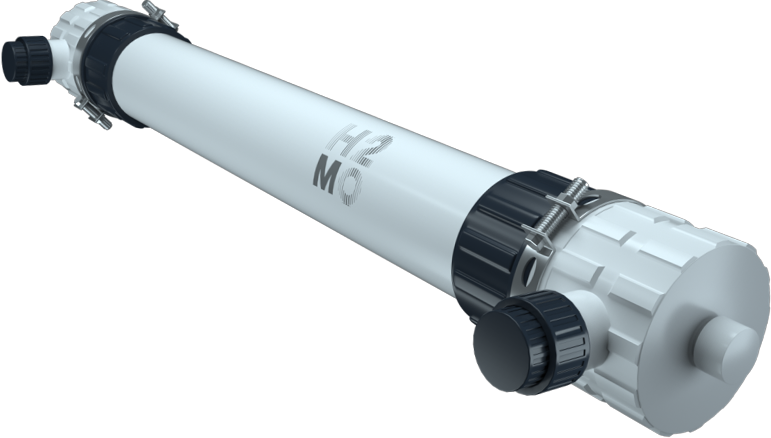
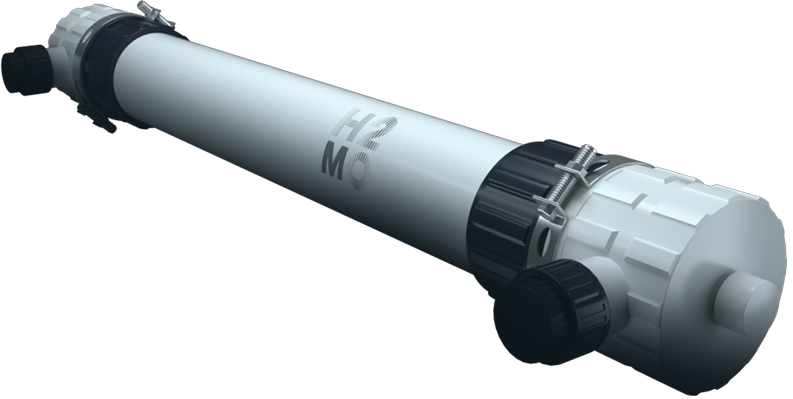
每个BPM-RO(UF-Type Module)都装在单独的机壳中,使得检测、识别和更换故障膜更加便利。

低压运行只需要正常的泵、设备和部件,降低了系统投资成本。

由于膜上的压力更低以及操作压力降低,化学清洗次数减少, 因而BPM 膜的使用寿命更长。

满足严格的排盐要求,从而持续生产高质量的水。

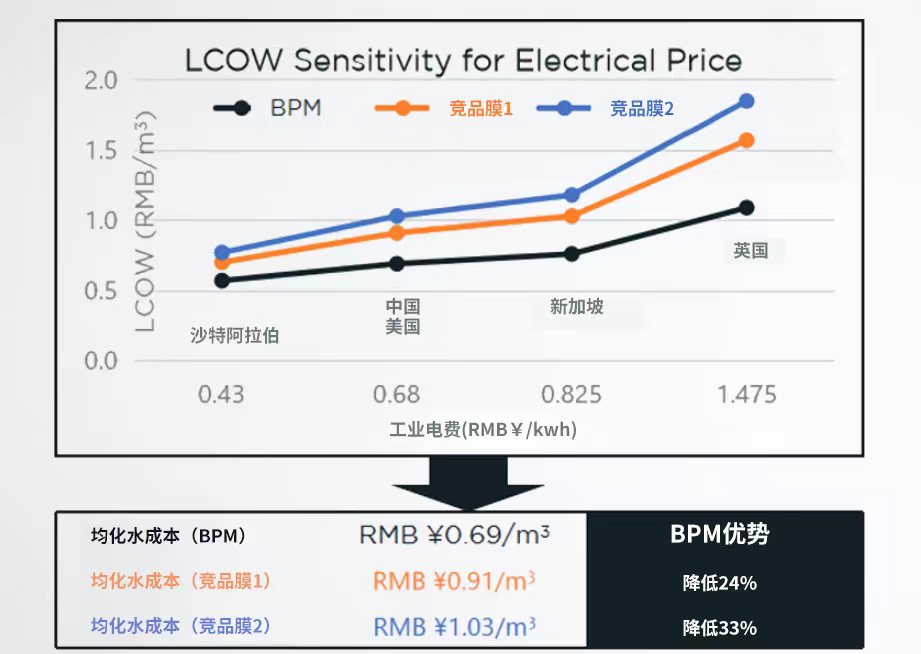
对 BPM-RO 进行了项目生命周期成本研究,并与其他市售的膜进行对比。
导出了水的均化成本(LCOW) ,表明 BPM-RO 膜装置与其他反渗透膜装置相比,实现了显著的低水平成本。
这主要归功于用电量和成本的大幅度下降。

节约电能 – 0.2 kwh/m³
节约能耗 – 50%-75%

减少碳排放 – 50 kg CO2/m³/年
拯救32棵树/m³/年
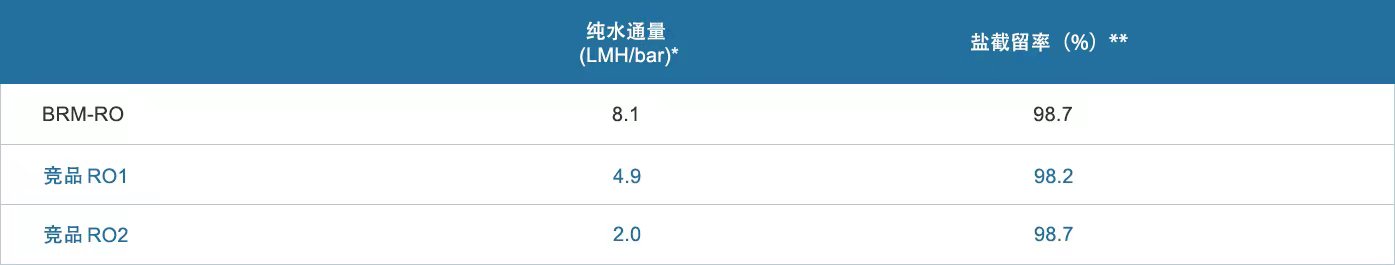
 注:*使用去离子水在压力4bar下测试。

BPM-RO 膜与最佳竞品反渗透膜
在新加坡 Newater 工厂的操作压力比较
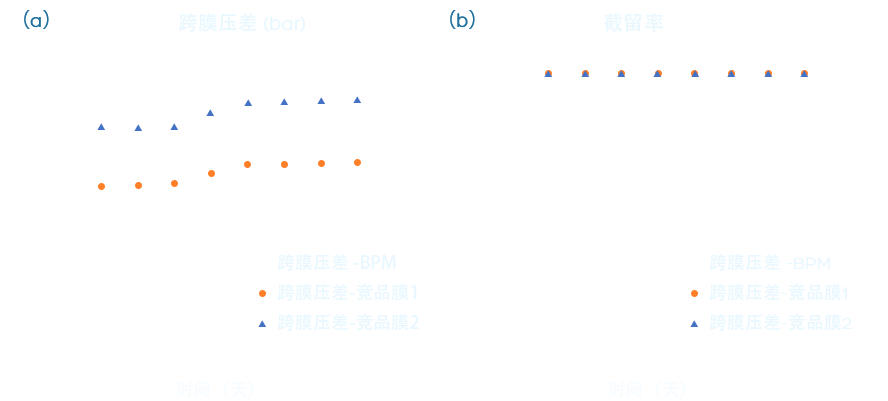
· 流量固定在20Imh
· BPM-RO膜操作压力为4bar
· 竞品RO膜操作压力为6.5-9 bar
· 普通RO膜操作压力为13-16bar
· 所有膜的截留率相同
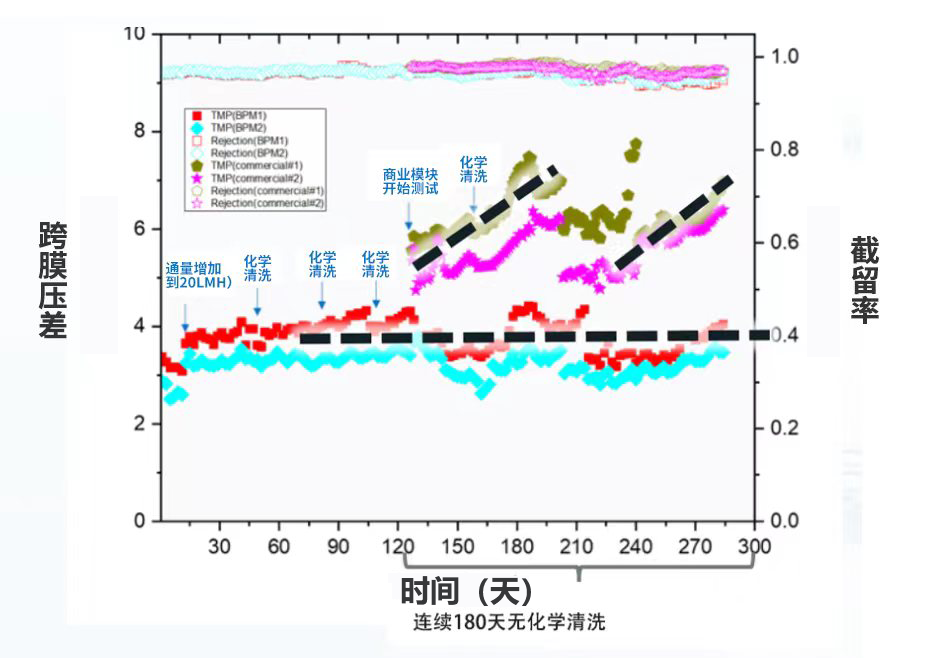
使用新加坡新生水厂的 MBR原液,用两个串联的 BPM-RO 模块和两个商业RO膜组件,在相同膜通量下的跨膜压力和截盐率的图示。